Seasonal Variations
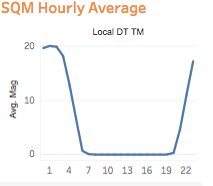
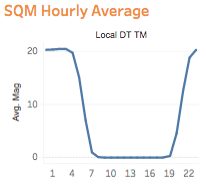
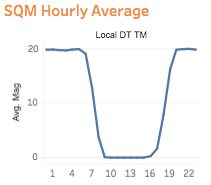
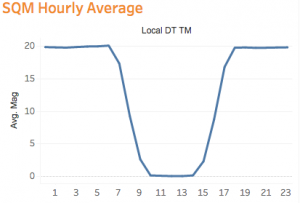
At varying times of the year, for example the summer solstice, the night sky will not get any darker than Astronomical Twilight. These seasonal variations can be observed in our dark sky data. The following four graphs represent the average dark sky readings across four months from June to December
- High readings indicate night (dark sky).
- Low readings (zero) represents daylight.
- The breath of the curve represents the length of the day. Across the four
- Across the four months, June has the longest day and December with the shortest.
JUNE 2016
|
AUGUST 2016
|
OCTOBER 2016
|
DECEMBER 2016
|
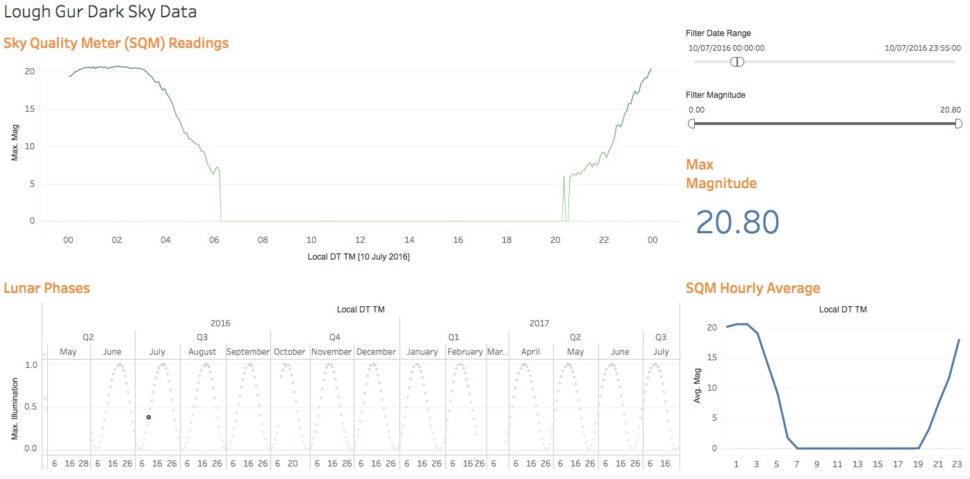
Year on Year Analysis
Question: Why do we take readings every 5 minutes even during daylight?
Answer: We wanted to look at variances in the length of days and capture any anomalies in the data during the days. For example what if there was a solar or lunar eclipse, what impact might that have on our data, especially when compared to a past date.
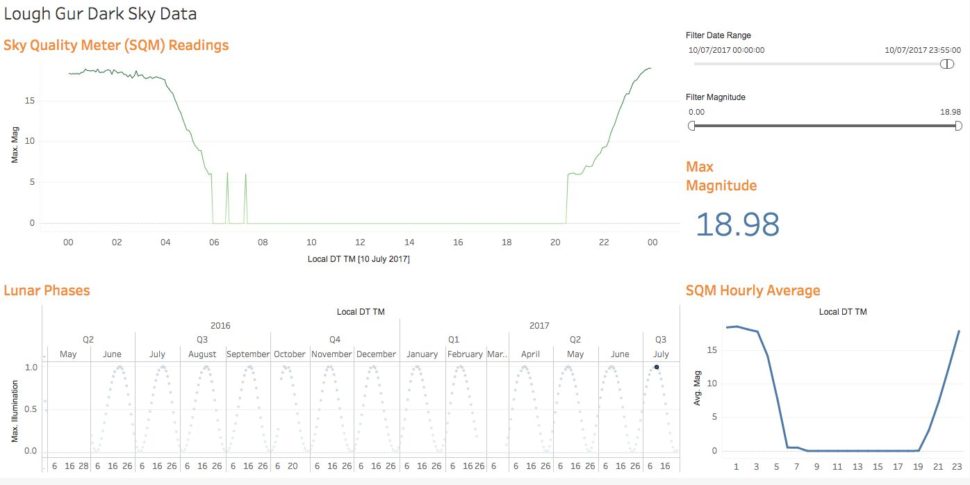
Question: Here is a view of our data from June 10th 2016 and June 10th 2017. Notice any variances?
Answer: While the curves and length of days are very similar, note the maximum SQM reading on each of the days. On June 10th 2016, the moon was waxing and only about 30% illuminated. However on June 10th 2017, at its median, the moon was at 99% luminosity, almost a full moon. Thus the darker sky in 2016.
JUNE 10th 2016 |
June 10th 2017 |